



What are Venn Diagrams?
A simple Venn diagram (invented by John Venn) is an infographic that has three overlapping circles. Each circle contains unique data points and common shared data in the center.
Why use them in your classroom?
Venn diagrams can be a useful tool for kids to show and compare sets of data or ideas on a worksheet. Venn diagrams are a useful infographic when introducing the idea of comparing and contrasting different sets of data. Graphs or flow charts are more complicated, whereas overlapping circles are an elegant way for kids to learn about unique and shared characteristics. Data visualization can be a complicated topic, so this is the simplest way to demonstrate set theory for budding mathematicians!
Why Kids might benefit from using Venn diagrams?
- Comparison: Venn diagrams can help kids compare and contrast different groups of items. By placing items in different sections of the diagram, they can see which sets of data are unique to each group and which are shared.
- Logical relationships: Venn diagrams can help kids develop their logical thinking skills. When brainstorming they can categorize items and identify similarities and differences between the sets of data.
- Problem-solving: Venn diagrams can be used as a problem-solving tool. Kids can use them to break down complex problems into smaller, more manageable pieces when decision-making.
- Visual learning: Many kids are visual learners, and Venn diagrams provide a clear infographic — a visual representation of information. They can help kids understand abstract concepts and see relationships between different pieces of information.
Free Venn diagram templates
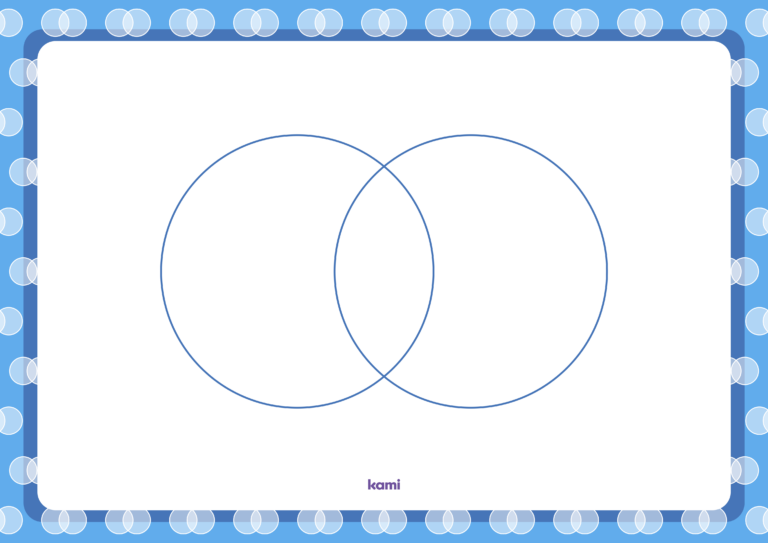


See these and more in the Kami Library
In light of the utility of Venn diagrams, we’ve developed some different templates for you to use with your students. All of our blank Venn diagrams are editable and allow kids to personalize them as they wish.
- Three-circle Venn diagram – mixed color design
- Three-circle Venn diagram – blue
- Three-circle Venn diagram – purple
- Three-circle Venn diagram – pink
- Two-circle Venn diagram – pink
- Two-circle Venn diagram – orange
- Two-circle Venn diagram – mixed color design (also available in landscape)
- Two-circle Venn diagram – blue (also available in landscape)
- Two-circle Venn diagram – purple (also available in landscape)
Exit ticket Venn Diagrams
These printable exit tickets are great for understanding what your kids have learned in their lessons. Use these Venn diagram-style exit ticket templates for your students to compare two subjects. Maybe it’s the end of the day and they want to compare what they learned in math to what they learned in English or maybe it’s the end of class and you’d like them to compare the subjects discussed.
We have an exit ticket Venn diagram template, as well as a blank Venn diagram template and finally a Venn diagram template with prompts.
Conclusion
Overall, Venn diagrams are a versatile and effective tool that can help kids develop a variety of skills, from logical thinking to problem-solving. The Venn diagram examples above are varied and diverse to inspire and prompt your students to better understand comparing and contrasting data. The circle Venn diagram template enables the students to edit with different fonts and make their own on their learning journey. With no pricing to worry about you have many different options at your fingertips.
Blogs you may also like

Author study ideas you can run in a 30-minute block


National Family Literacy Month ideas for home and school
Book Creator’s new classroom writing tool puts formatting controls where students can actually use them